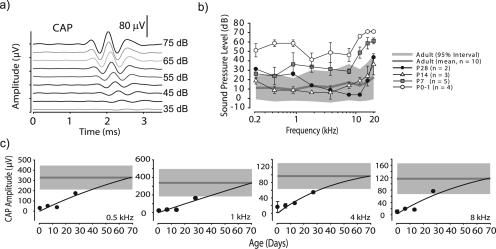
Figure 3.
(Color online) (a) Example of CAPs as a function of SPL for a 8 kHz stimuli. (b) Across-animal mean CAP thresholds for animals of five age groups, error bars indicate ± 1 SD. Mean and 95% confidence interval for adults shown as in Fig. 2b. (c) Development of CAP amplitude computed at 70 dB SPL vs age for four frequencies. Mean and 95% confidence intervals for adults are shown as in Fig. 2d. Error bars indicate ± 1 SD.

