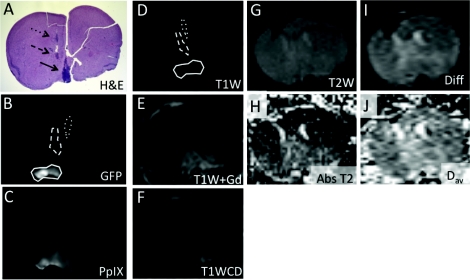
Figure 1.
The diffusely growing U251-GFP tumor images are shown using ex vivo fluorescence, in vivo MR imaging, and ex vivo H&E staining. (a) H&E staining of a mouse brain implanted with U251-GFP shows three regions (black arrows – dotted, dashed, and solid) of diffusely growing glioma cells. H&E was used as the gold standard for tumor detection. (b) GFP fluorescence from thick tissue slices was used to determine the ROIs for fluorescence and MR imaging contrast analysis. The three ROIs are circled with dotted, dashed, and solid lines corresponding to the ROIs indicated in (a). (c) PpIX fluorescence of the same tissue slice was analyzed. The following MR imaging scans were also analyzed for tumor contrast: (d) T1W without gadolinium contrast [dotted, dashed, and solid circles correspond to GFP fluorescence ROIs indicated in (b)], (e) T1W with gadolinium, (f) T1W contrast difference, (g) T2, (h) absolute T2, (i) diffusion, and (j) Dav image. The ROIs created in the MR images corresponding to fluorescence and H&E images are shown in the T1W without gadolinium image (d).

