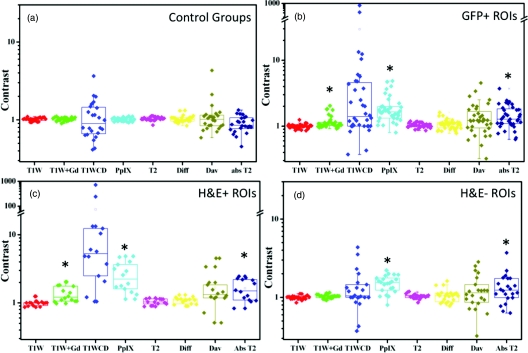
Figure 2.
The comparison of MRI and fluorescence contrast (where contrast = [ROI] / [Contralateral ROI]) of the control mice (a), and the GFP+ ROIs (b) show that the T1W+Gd, absolute T2, and PpIX fluorescence are all significant (black asterisks) from the controls. The GFP+ ROIs are further broken down into groups of H&E + ROIs (c) and H&E − ROIs (d) to illustrate the large variation between these two groups. The H&E positive ROIs have the same statistically significant groups as all tumor bearing mice, but the H&E negative ROIs are only significant for PpIX fluorescence and T2 map.

