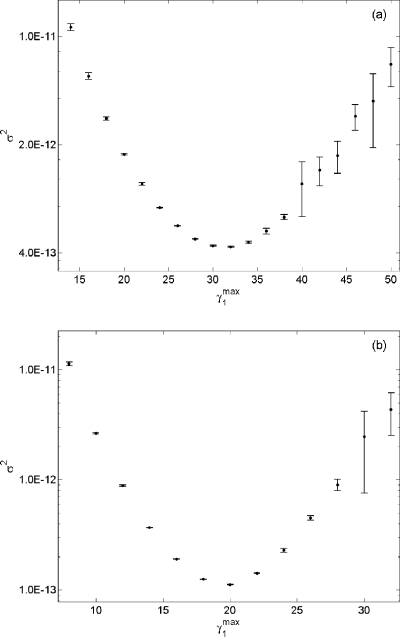
Figure 7.
(a) A plot of σ2 vs obtained in wSSA runs of reaction 18 using Here we estimate p(40,80;100) for S2. Each vertical bar shows the estimated mean and one standard deviation of σ2 at that value as found in four n=105 runs. (b) A plot of σ2 vs obtained using the same setting as in Fig. 7a, except ρ10=0.55.

