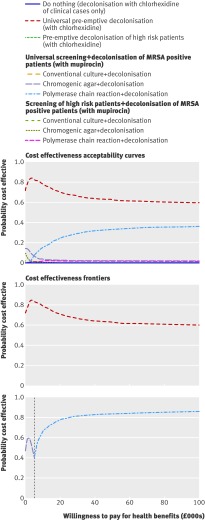
Fig 2 Cost effectiveness acceptability curves and frontiers for screening and decolonisation strategies. Each line on cost effectiveness acceptability curve represents the proportion of simulations for a particular strategy that are cost effective, under a range of values for willingness to pay for health benefits. Lines in cost effectiveness acceptability frontiers depict scenarios with highest expected net monetary benefit, dependent on willingness to pay for health benefits. The first frontier compares all strategies; the second excludes universal decolonisation

An official website of the United States government
Here's how you know
Official websites use .gov
A
.gov website belongs to an official
government organization in the United States.
Secure .gov websites use HTTPS
A lock (
) or https:// means you've safely
connected to the .gov website. Share sensitive
information only on official, secure websites.
