
Figure 2.
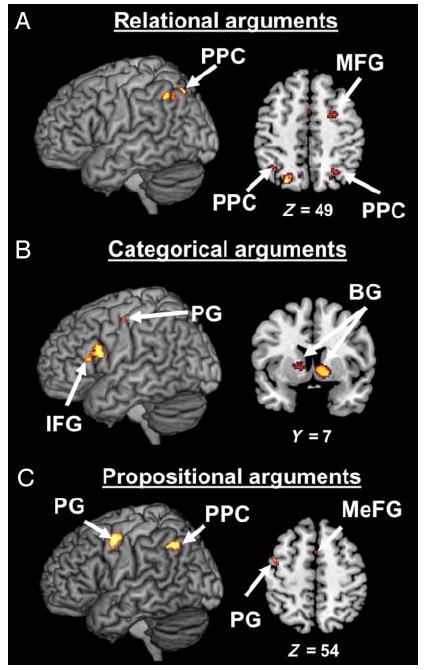
Density analyses performed separately for studies employing relational, categorical, and propositional arguments. (A) MKDA map representing the regions most consistently activated in neuroimaging studies employing relational arguments. (B) MKDA map representing the regions most consistently activated in neuroimaging studies employing categorical arguments. (C) MKDA map representing the regions most consistently activated in neuroimaging studies employing propositional arguments. Activations are overlaid on 3-D renderings and slices of the MNI-normalized anatomical brain.