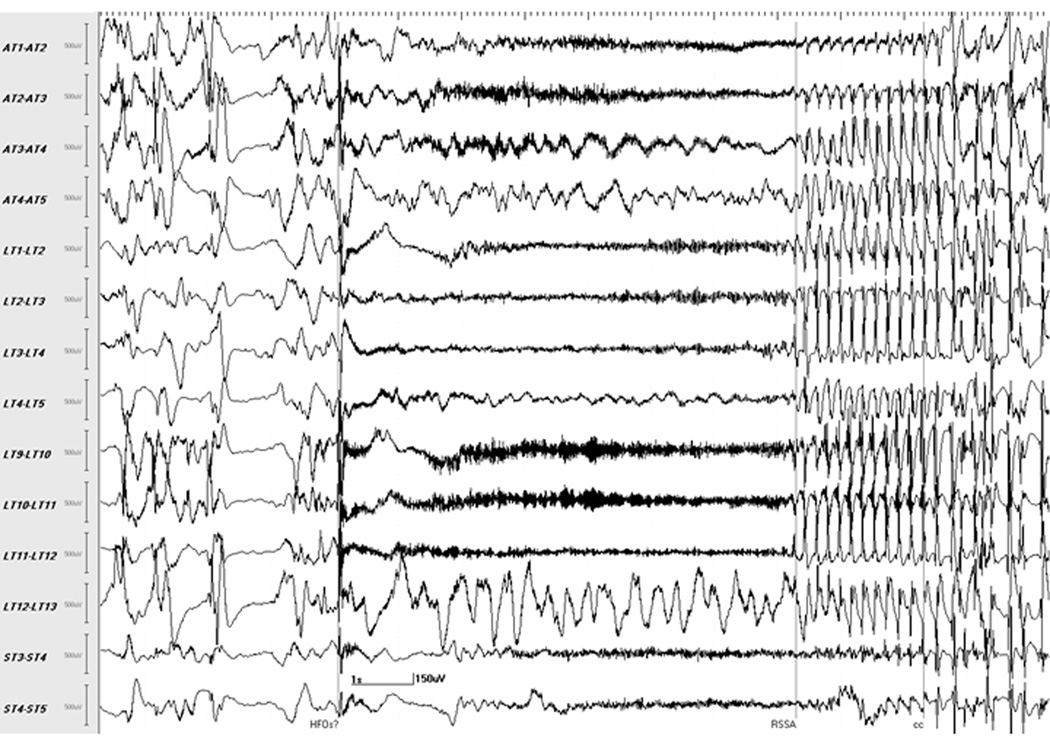
Fig. 1.
Localization of seizure onset using conventional setting. Selected channels of subdural recording of seizure 3 from patient F, visualized at 10 sec/page, 1.6–70 Hz bandpass/60 Hz notch filter, shows the point of occurrence of readily identifiable rhythmic activity indicating seizure spread (marker: RSSA). Reviewing backwards from this point reveals the seizure onset occurring a few seconds earlier, consisting of a sharp transient in multiple channels followed by slow waves with superimposed fast activity suggestive of high frequency oscillations (marker: HFOs?). At this filter setting, HFOs are seen as thick, dark waveforms initially in the LT (9–10, 10–11 and 11–12) and AT (2–3 and 3–4) channels with subsequent involvement of ST (3–4 and 4–5), AT (1–2) and LT (1–2, 2–3 and 3–4) channels. Earliest clinical change in this seizure (marker: cc), consisting of repetitive eye blinks, occurred several seconds after the electrical onset.

