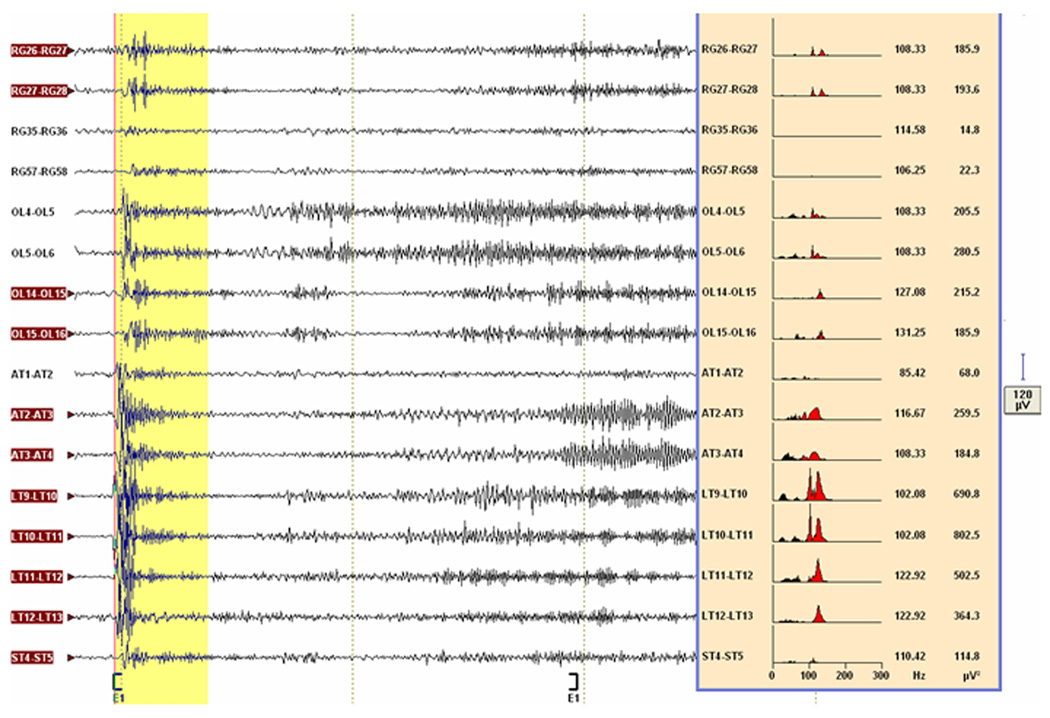
Fig. 3.
Seizure localization by post-hoc spectral analysis. Selected channels of the subdural recording of seizure 1 from patient F, visualized with 50–300 Hz bandpass/60 Hz notch filter, shows the high frequency oscillations (HFOs) on the left side of the figure. Note that the block E1 enclosed by the square brackets is 2 sec long. A 400-ms epoch (highlighted in yellow) is placed at the beginning of this block. The fast Fourier transform-derived power spectra over this epoch (≥70 Hz in red, <70 Hz in black), the dominant frequencies (Hz) and power (µV2) are shown at the right side of the figure. Although all the depicted channels could be considered as potential ictal HFOs channels because of dominant frequencies ≥70 Hz, the three channels (RG35-36, RG57-58 and AT1-2) would not qualify as ictal HFOs channels because of their power being <median power. The channels with subsequent evolution of the ictal HFOs into slower frequency activity (i.e., HFOs+ev channels) are highlighted. See text for details.

