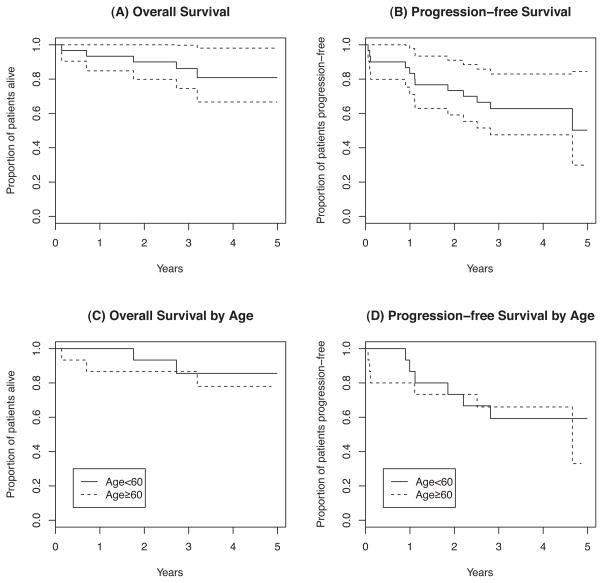
Figure 2.
Kaplan-Meier curves for overall and progression-free survival. (A) Overall survival (95% confidence interval); (B) Progression-free survival (95% confidence interval); (C) Overall survival stratified by age (< 60 years vs. ≥ 60 years); (D) Progression-free survival stratified by age (< 60 years vs. ≥ 60 years).

