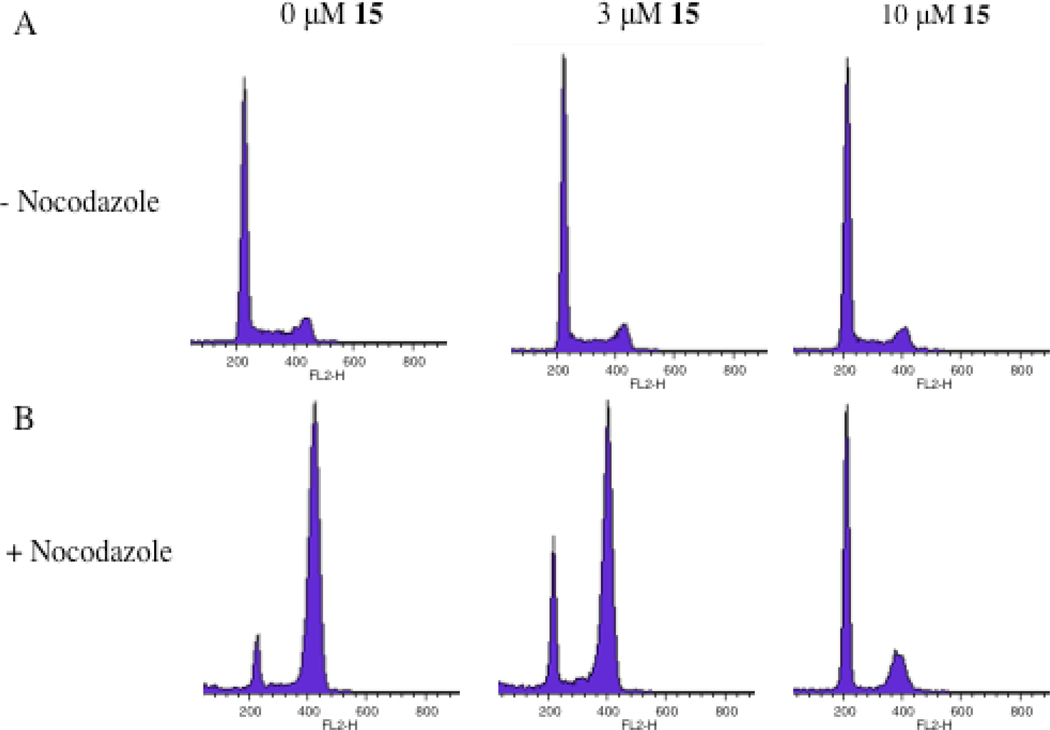
Figure 6.
Effect of clodronate prodrug 15 on cell cycle, determined using the PI and FACS analysis. A) A549 cells treated with 0, 3, and 10 µM of 15 for 72 h. B) A549 cells treated with 0, 3, and 10 µM of 15 for 72 h and nocodazole for the final 24h. In the nocodazole-treated cells, accumulation of cells in G1 phase is evident at 3 and 10 µM of 15.

