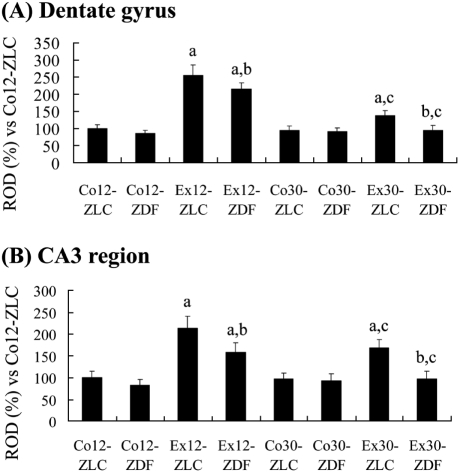
Figure 4.
Relative optical densities (ROD) as percentage values of COX-2 in the dentate gyrus (A), and CA3 (B) of Co12-ZLC, Co12-ZDF, Ex12-ZLC, Ex12-ZDF, Co30-ZLC, Co30-ZDF, Ex30-ZLC and Ex30-ZDF rats. Differences among the means were analyzed statistically by two-way analysis of variance followed by Duncan's new multiple range method (n=5 per group; aP<0.05, significantly different from control group; bP<0.05, significantly different from the ZLC group; cP<0.05, significantly different from the 12-week-old group). Bars indicate the SEM.

