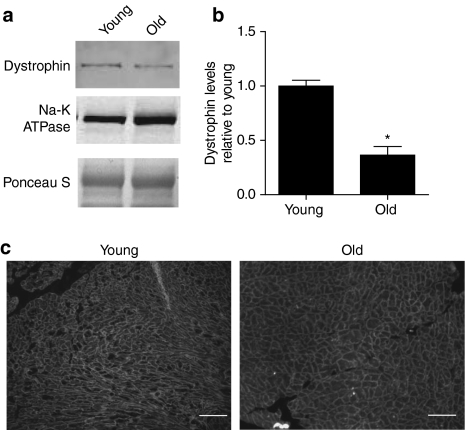
Figure 1.
Quantification of dystrophin levels in membrane preparations from young and old mouse hearts. (a) Representative blot demonstrating dystrophin (C-terminal) and Na-K ATPase expression. (b) Summary of blot quantification, dystrophin levels from old hearts are 36% that of young hearts. Data is from 9 young hearts and 17 old hearts. (c) Immunofluorescent assessment of dystrophin subcellular localization in young versus old hearts. Bar represents 100µm, *Indicates a significant difference of P < 0.0001 by t-test.

