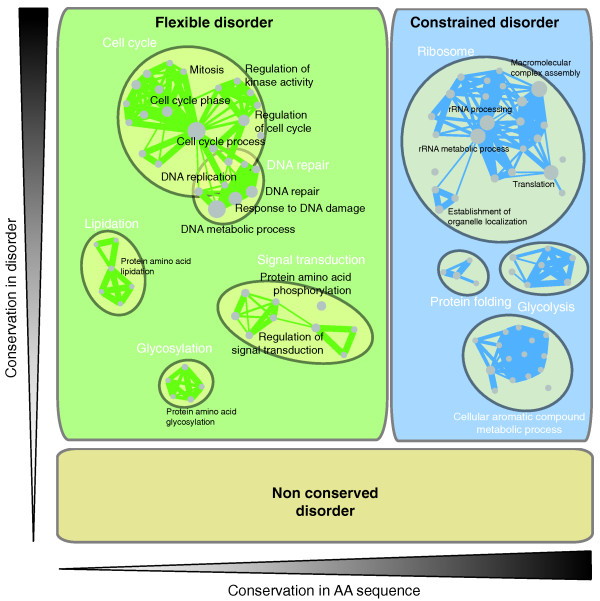
Figure 7.
Disorder splits into three distinct phenomena. Functional enrichment maps of proteins enriched in flexible disorder versus constrained disorder. The area of each rectangle is proportional to the representation of that type of disorder in the alignments. Related GO terms are grouped based on gene overlap (see Materials and methods; Figures S20, S21 and S22 in Additional file 1).

