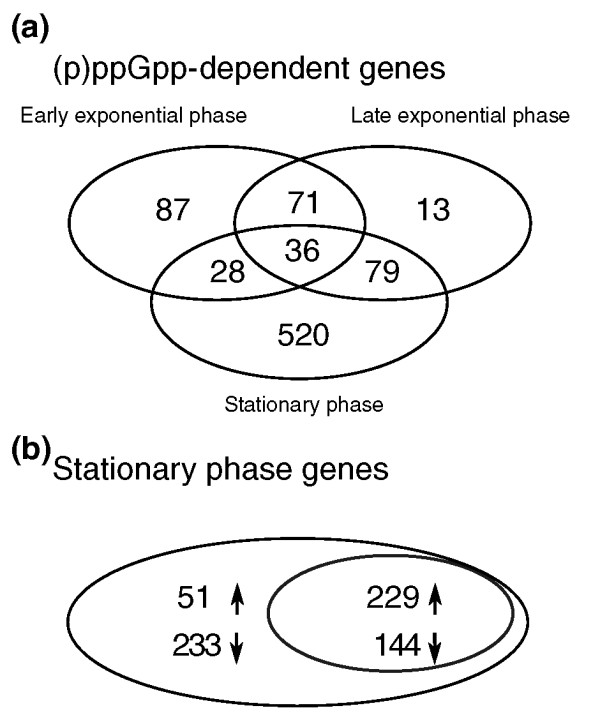
Figure 2.

(p)ppGpp-dependent gene expression. (a) Venn diagram of all differentially expressed (p)ppGpp-dependent genes during early exponential phase, late exponential phase and stationary phase. (b) Venn diagram of all genes expressed during stationary phase (large ellipse). The overlap with (p)ppGpp-dependent genes (see (a)) shows all (p)ppGpp-dependent stationary phase genes (small ellipse). Upwards and downwards oriented arrows indicate gene induction and repression, respectively.
