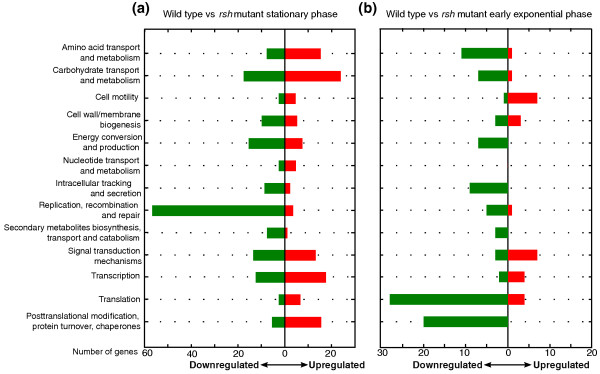
Figure 4.
Differentially expressed genes grouped by functional categories. Up- and downregulated (wild type versus rsh mutant) genes are indicated by red and green bars, respectively, representing the number of genes per functional category. Functional categories of the RhizoBase database were used [92]. (a) Stationary phase data of wild type versus rsh mutant. (b) Early exponential data of wild type versus rsh mutant.

