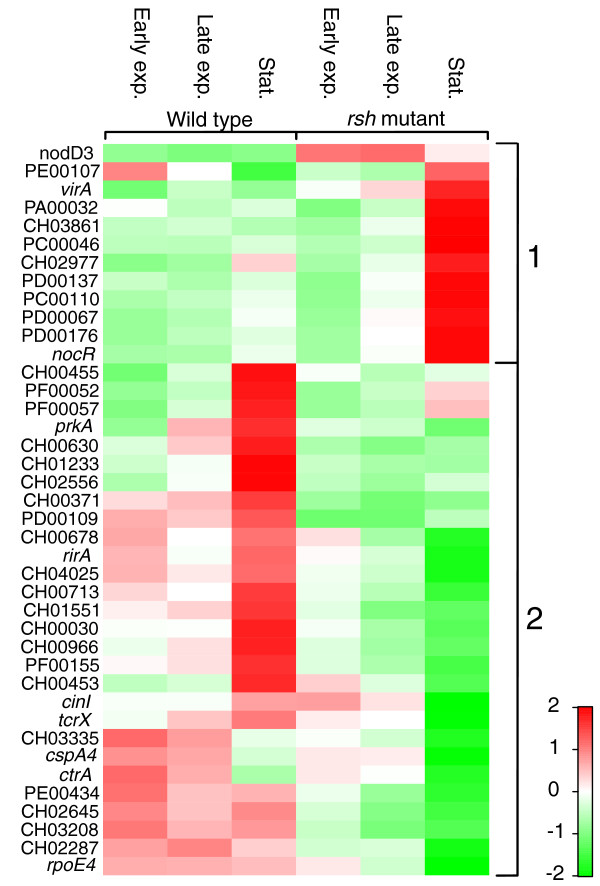
Figure 5.
Clustering of differentially expressed signal transduction and transcription-related genes. The heat map visualizes the expression profiles of all differentially expressed genes belonging to the transcription category and signal transduction category in the wild type and rsh mutant during stationary phase. The expression values in each row were standardized by subtraction of the mean and division by the standard deviation and hierarchically clustered. Expression values are reflected by red-green coloring as indicated. Genes showing similar expression patterns are grouped as follows: group 1, genes under negative (p)ppGpp control during stationary phase; group 2, genes under positive (p)ppGpp control during stationary phase. Exp., exponential; Stat., stationary.

