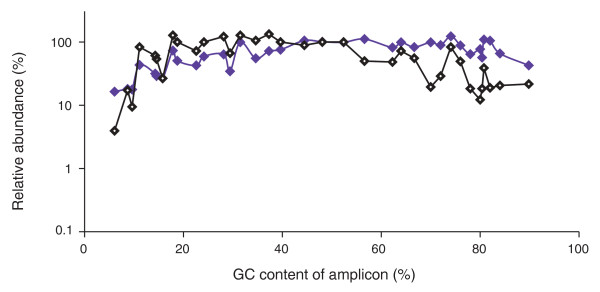
Figure 4.
Comparing input library and output sequencing data. Shown is the relative abundance of loci in the library as determined by qPCR (purple) and the relative abundance of Illumina sequencing reads covering these loci in one lane of Hi-Seq data (black). Both data sets were normalized to the average of the two loci closest to 50% GC.

