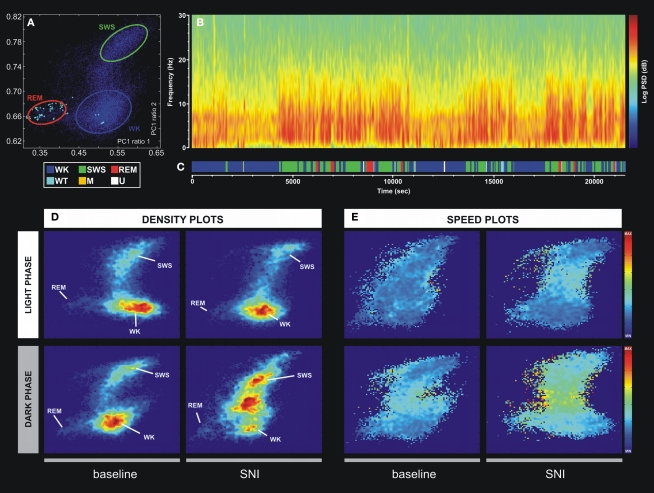
Figure 2.
Example of the technique used for statistical classification of oscillatory patterns according to Principal Component Analysis of the LFP signals. (A) Two-dimension brain StateMap. Three major clusters were represented corresponding to waking state (WK), slow-wave-sleep (SWS) and rapid-eye-movement (REM) states. (B) Power spectrogram of a SI LFP channel showing the different patterns of signal power oscillations across brain state episodes transitions. (C) Brain states hypnogram obtained from two-dimensional state illustrated in panel A. Six different brain states were coded: WK, SWS, REM, whisker-twitching (WT), M (undefined movement), and U (transition states). (D) Density plots calculated from scatter plots [e.g., (A)], showing the conserved cluster topography and the relative abundance of the various brain states. Scale from dark-blue (low-density) to red (high-density). (E) Speed plots representing the average of spontaneous trajectories within the two-dimensional StateMap. Stationarity (low speed) can be observed in the three main clusters (WK, SWS, and REM), whereas a maximum speed is reached during transitions from one clusters to another. After SNI lesion the velocity between WK and SWS state episodes increased, suggesting also an increase of WK/SWS transitions during the neuropathic pain period.

