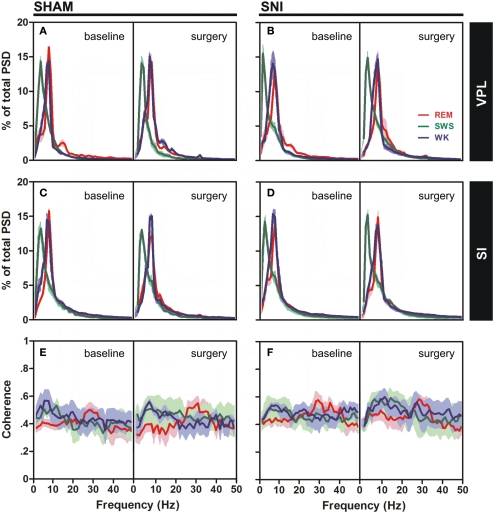
Figure 3.
Spectral analysis of SI–VPL LFPs channels during WK (blue), SWS (green), and REM (red) states. Data were presented comparing the baseline (left side of each panel) and respective SHAM or SNI lesion (right side). Values are expressed for all animals as mean (±SEM). (A–D) Power spectral density (PSD) of LFPs normalized by the percentage of total power within the frequency range analyzed (1–50 Hz) for VPL (A,B) and SI (C,D) channels. PSD showed that spectral power patterns were conserved across the experimental groups. (E,F) Coherence between VPL and SI LFPs showed similar levels of coherence activity across all experimental groups.

