
Figure 1.
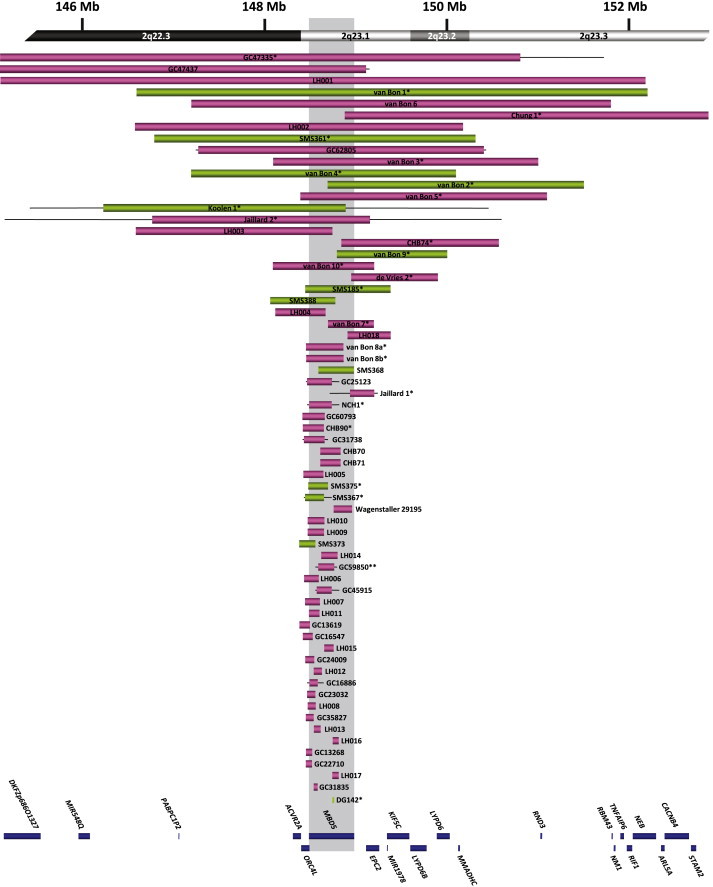
Delineation of the 2q23.1 Critical Region
Schematic representation of MBD5-containing deletions and translocation breakpoints in this report and those previously reported in the literature, arranged from largest to smallest. Boxes represent the minimum size of the deletions, and the horizontal lines extend through gaps in coverage to show the maximum deletion sizes. Green boxes represent individuals with MBD5 expression studies reported here. Single asterisks indicate cases known to be de novo; a double asterisk indicates a single inherited case in the cohort. Inheritance regarding all other cases is unknown. Genes within the region are represented by blue boxes, and the shaded region shows the location of MBD5.