
Figure 2.
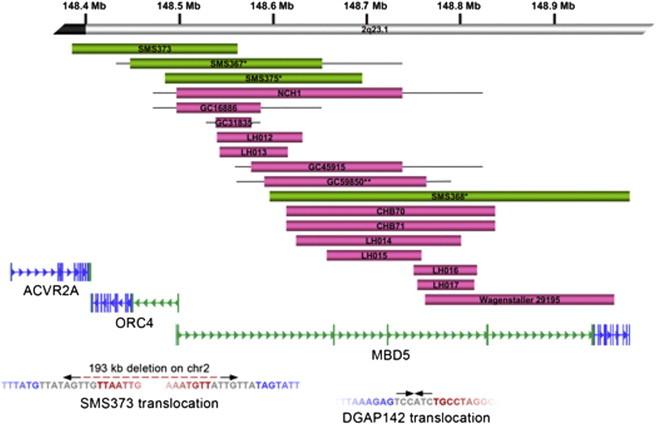
Deletions and Translocations Disrupting MBD5
(Top) Schematic representation of intragenic and partial deletions of MBD5. MBD5 genomic organization and mRNA (RefSeq Accession: NM_018328) are provided, including the large noncoding region (in green) between exon 1 and the coding sequence start site (in blue). Above the gene are the 18 microdeletions that partially and/or exclusively disrupt MBD5. These subjects had similar phenotypic features to individuals with deletions of the full 2q23.1 region (Table 1). Green bars represent those cases with expression data shown in Figure 4. Single asterisks indicate cases known to be de novo; the double asterisk indicates a single inherited case in the cohort. Inheritance regarding all other cases is unknown.
(Bottom) Translocation breakpoints in MBD5. Below the gene are paired-end sequencing data from two translocations found to disrupt MBD5. The arrows represent the orientation of sequence reads (inward facing for CapBP, outward facing for jumping libraries). The breakpoint on chromosome 2 in SMS373 was localized to the MBD5 noncoding region but determined to be an unbalanced rearrangement with derivative breakpoints separated by 193 kb on chromosome 2 and 106 kb on chromosome 10. DGAP142 yielded read pairs that localized the junction fragment to the same noncoding region23 with the loss of a single base at the chromosome 22 breakpoint in a region without annotated genes or functional sequences. Breakpoint sequences are given below the reads. The blue sequence represents the chromosome 2 breakpoint; the red sequence represents the chromosomal partner sequence, and the sequence at the breakpoint that does not map to either chromosome partner is inserted in gray. Breakpoints for both derivatives resulting in the 193 kb deletion of chromosome 2 are shown for SMS373. The second derivative of DGAP142 was balanced and identical to the reference.