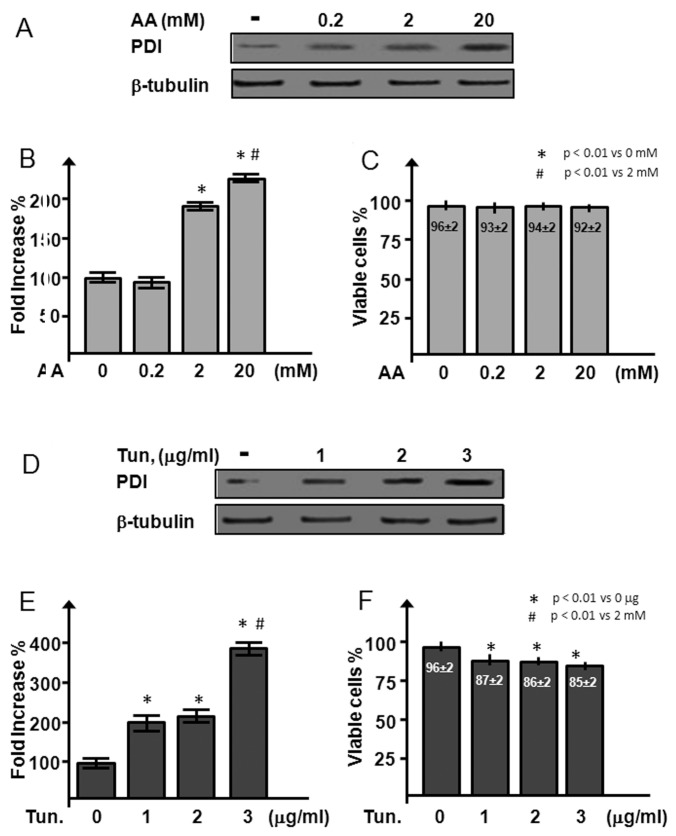
Figure 5.
PDI induction and cell viability after AA and tunicamicyn treatment in cultured cardiomyocytes. (A–C) Western blot (A) and densitometric analysis of PDI (B) in HL-1 cells after treatment with increasing doses (0.2, 2 and 20 mmol/L) of AA; cells were stained with trypan blue to exclude unhealthy cells (C). (D–F) Western blot (A) and densitometric analysis of PDI (B) were performed with increasing doses (1, 2 and 3 μg/mL) of tunicamicyn (Tun.) in HL-1 cells; trypan blue exclusion (C) was used to determine viable cells. Results are expressed as mean ± SE percentage with respect to control cells; n = 3 for each experimental point.

