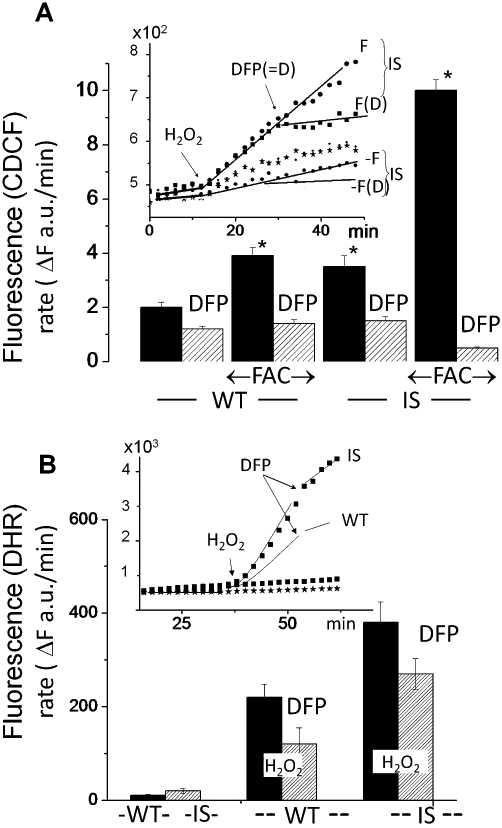
Figure 4.

Iron loading and erythrophagocytosis by RAW 264.7 [wild type (WT) and iron-sensitive (IS)] macrophages: formation of reactive oxygen intermediates (ROI). WT and IS cells were preincubated overnight with/without 50 µM ferric ammonium citrate (FAC) (F) and subsequently loaded with dihydro-2-7-carboxy-dichlorofluorescein (dihydro-CDCF) [via the cell permeant precursor acetoxymethyl ester CDCF-acetomethoxy (CDCF-AM) (A) or with dihydrorhodamine 123 (B)]. The time-dependent changes in fluorescence intensity [(mean of triplicate values given in arbitrary fluorescence units (a.u.)] are shown in the insets of (A) and (B) illustratively for only the indicated treatments. The fluorescence traces shown in each graph were obtained concurrently at 37°C in a thermostated fluorescence plate reader. After a stable baseline cell fluorescence signal was detected, 50 µM H2O2 and 50 µM deferiprone (DFP) (= D) were added sequentially 20 min apart (indicated by arrows; the sets not exposed to H2O2 are denoted as -). Histograms in the main figure (A, B) show the rates of fluorescence increase (ΔF a.u.·min−1) calculated from the linear segments of the fluorescence profiles shown in the insets (shown illustratively for the indicated conditions).
