
Figure 4.
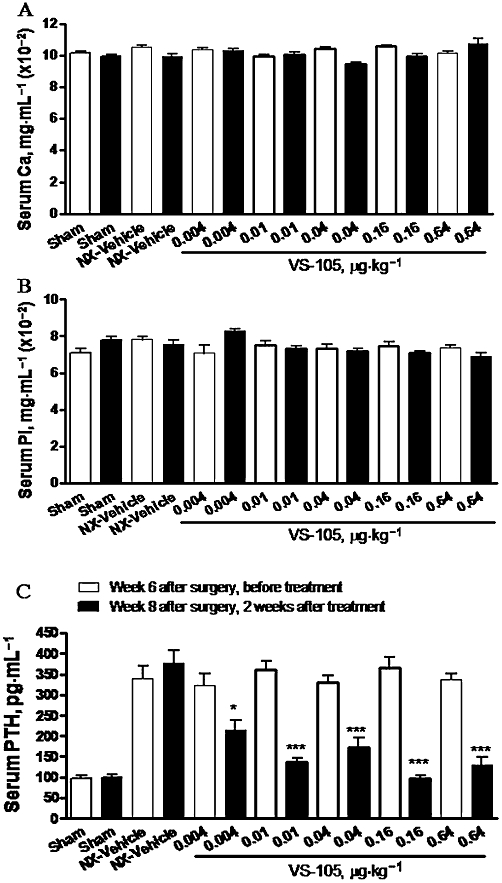
Effects of VS-105 on serum Ca, Pi and PTH levels after 2 weeks of i.p. dosing in the 5/6 NX rats. Rats were treated as in Figure 3. Blood samples were collected for the measurement of serum Ca (A), Pi (B) and PTH levels (C). Means ± SEM were calculated for each group. Unpaired t-test with 95% confidence intervals of difference was performed to assess differences between baseline Day 0 (before treatment) and Day 13 (after treatment). *P < 0.05, ***P < 0.001 versus before treatment.