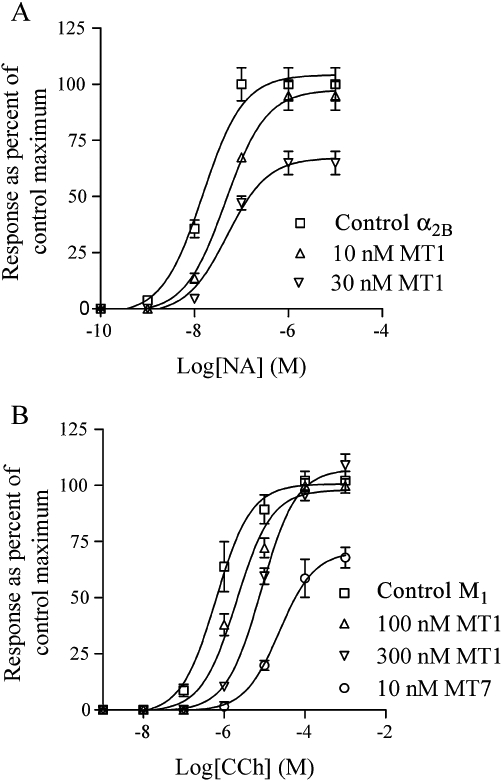
Figure 4.

Sf9 cells expressing the α2B-adrenoceptor (A) or M1 mAChR (B) were loaded with fura-2 and subjected to fluorescence recordings to measure intracellular [Ca2+] levels. Different concentrations of toxins were added to aliquots of cells and incubated for ≥60 min. Control cells were treated similarly with vehicle. Noradrenaline (NA) and carbachol (CCh) were used to stimulate the α2B and M1 receptors, respectively. Data points (means ± SD, n = 3–5) are given as % of control maxima. The absolute response maxima varied somewhat between days of experimentation. For α2B-AR, the response maxima were in the range 570–743 nM and for M1 in the range 214–254 nM. Data for MT7 were included for comparison with the effect of a toxin with high affinity binding to the M1 receptor.
