
Figure 6.
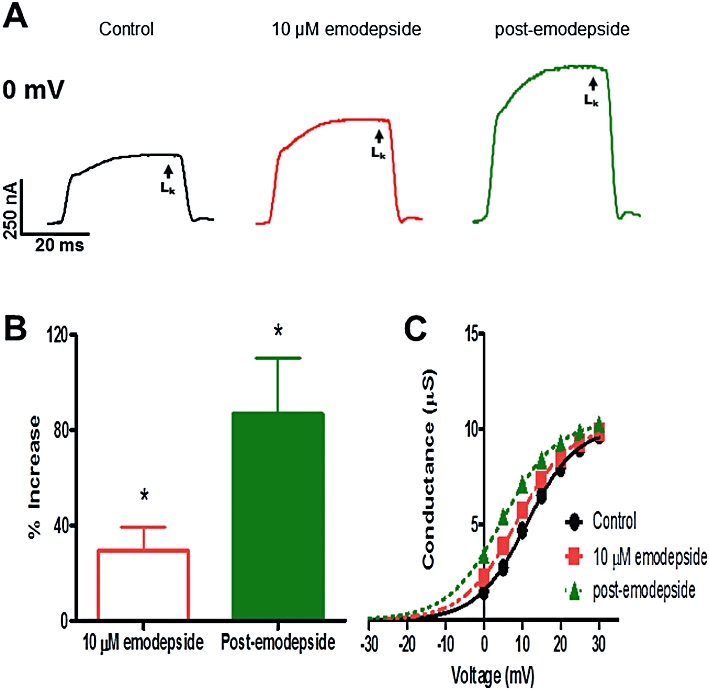
Effect of emodepside (10 µM) on the voltage-activated LK currents. (A) Representative traces of the control LK current, the effects of emodepside on the current and the post-emodepside LK current all at 0 mV. (B) Bar chart (mean ± SEM) of % increase in LK currents produced by emodepside (P < 0.05, n = 6, paired t-test) and the continued increase at the post-emodepside period (P < 0.05, n = 6, paired t-test). (C) Sample activation curve of the LK currents; conductance-voltage plots were fitted to the Boltzmann equation. Emodepside shifted the V50 in the hyperpolarization direction and the shift was sustained during the post-emodepside period. Essentially no change in Gmax was observed.