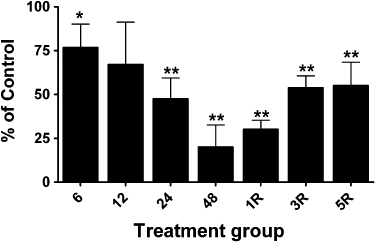
Figure 5.

Changes in ALDH2 protein levels in femoral veins from GTN-treated animals. Rats were treated with 0.4 mg·h−1 GTN for 6, 12, 24 or 48 h (6, 12, 24, 48) or for 48 h followed by a 1-, 3- or 5-day GTN-free period (1R, 3R, 5R). ALDH2 protein was determined by immunoblot analysis and immunoreactive bands were quantified by densitometry. ALDH2 protein levels in aortae (normalized to β-actin) from GTN-treated animals are expressed as a percentage of the levels in matching control animals. Data are presented as the mean percentage of control ± SD (n = 4) and were analysed using Student's one-sample t-test. *P < 0.05, **P < 0.01, significant decrease compared with Control.
