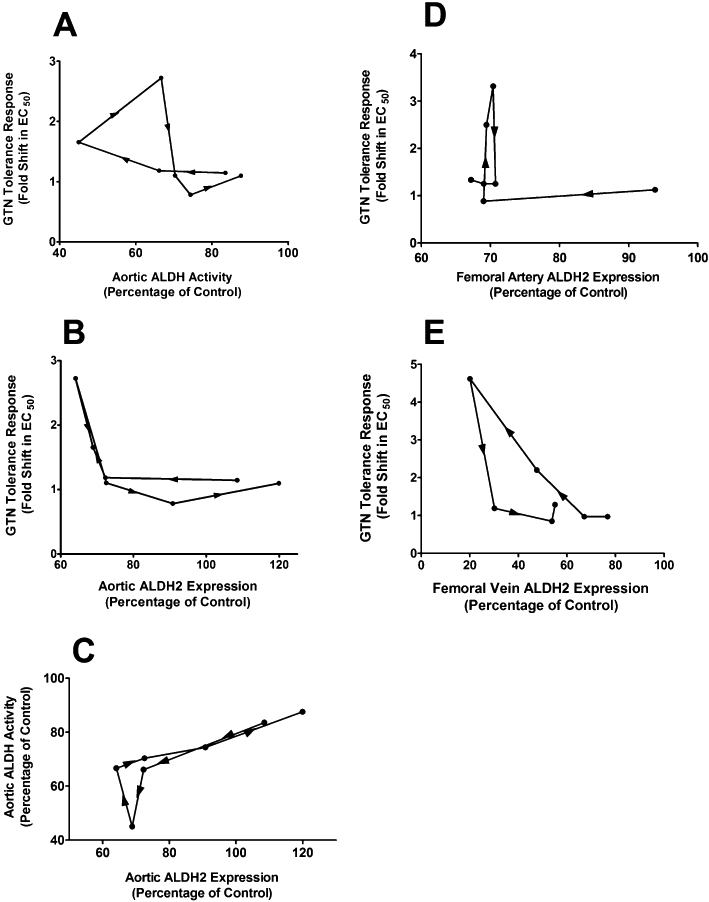
Figure 7.

Hysteresis plots of ALDH2 status and fold shift in EC50 values for GTN-induced relaxation of various blood vessels. The fold shift in EC50 values for relaxation of aorta (A–B), femoral artery (D) and femoral vein (E) is plotted as a function of either ALDH activity (as a percentage of control) (A) or ALDH2 expression (as a percentage of control) (B–E). (C) Plot showing hysteresis of aortic ALDH activity as a function of aortic ALDH2 expression. Data are plotted as the mean percentage of control vs. mean fold shift in EC50 values. (n = 4–10).
