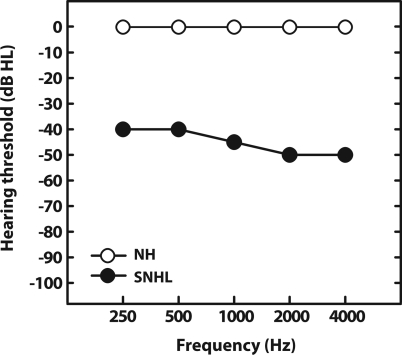
Figure 1.
Audiograms for normal-hearing and hearing-impaired conditions. The impaired audiogram was modeled after data reported by Tufts et al. (2005) who measured musical interval consonance rankings in subjects with a flat, moderate, sensorineural hearing loss (SNHL). Pure-tone averages (PTAs) for normal and impaired models are 0 and 45 dB HL, respectively.

