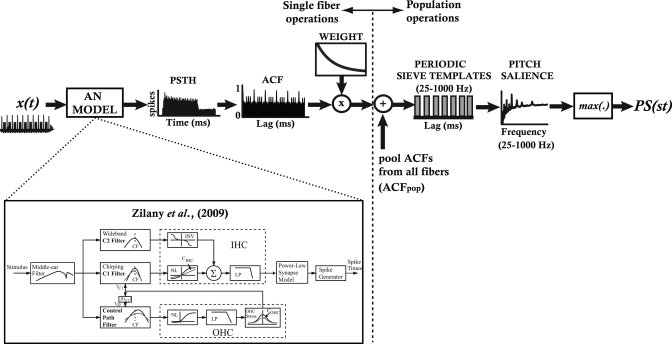
Figure 2.
Procedure for computing neural pitch salience from AN responses to musical intervals. Single-fiber operations vs population-level analyses are separated by the vertical dotted line. Stimulus time waveforms [x(t) = two note pitch interval] were presented to a computational model of the AN (Zilany et al., 2009) containing 70 model fibers (CFs: 80−16 000 Hz). From the PSTH, the time-weighted autocorrelation function (ACF) was constructed for each fiber. Individual fiber ACFs were then summed to create a pooled, population-level ACF (ACFpop). The ACFpop was then passed through a series of periodic sieve templates. Each sieve template represents a single pitch (f0) and the magnitude of its output represents a measure of neural pitch salience at that f0. Analyzing the outputs across all possible pitch sieve templates (f0 = 25−1000 Hz) results in a running salience curve for a particular stimulus (“Pitch salience”). The peak magnitude of this function was taken as an estimate of neural pitch salience for a given interval (PS(st), where st represents the separation of the two notes in semitones). Inset figure showing AN model architecture adapted from Zilany and Bruce (2006), with permission from The Acoustical Society of America.

