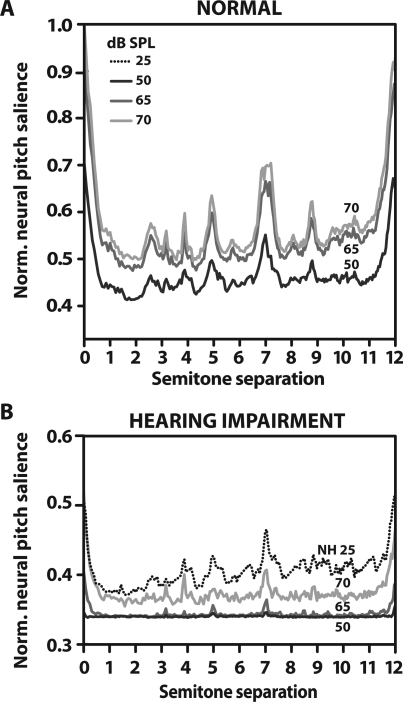
Figure 5.
(Color online) Normal-hearing (A) and hearing-impaired (B) estimates of neural pitch salience as a function of level. Little change is seen in the NH “consonance curve” with decreasing stimulus presentation level. Level effects are more pronounced in the case of HI where consonant peaks diminish with decreasing intensity. Even after equating sensation levels, NH responses still show a greater contrast between consonant peaks and dissonant troughs than HI responses indicating that the reduced contrast seen with HI cannot simply be explained in terms of elevated hearing thresholds. For ease of SL comparison, NH at 25 dB SPL (dotted line) is plotted along with the HI curves in B (i.e., NH at 25 dB SPL and HI at 70 dB SPL are each ∼25 dB SL). All values have been normalized to the maximum of the NH 70 dB SPL curve, the unison.

