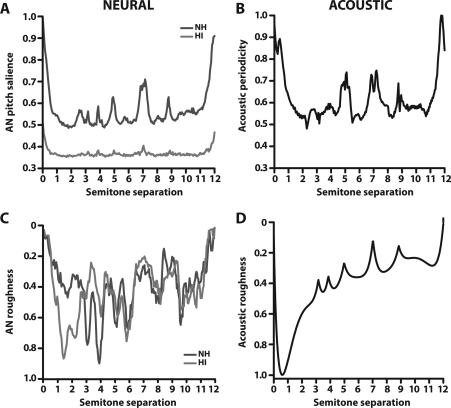
Figure 6.
(Color online) Continuous plots of acoustic and neural correlates of musical interval perception. All panels reflect a presentation level of 70 dB SPL. Ticks along the abscissa demarcate intervals of the equal tempered chromatic scale. Neural pitch salience (A) measures the neural harmonicity∕periodicity of dyads as represented in AN responses (same as Fig. 5), and is shown for both normal-hearing (NH) and hearing-impaired (HI) conditions. Similarly, periodic sieve analysis applied to the acoustic stimuli quantifies the degree of periodicity contained in the raw input waveforms (B). Consonant intervals generally evoke more salient, harmonic neural representations and contain higher degrees of acoustic periodicity than adjacent dissonant intervals. Neural (C) and acoustic (D) roughness quantify the degree of amplitude fluctuation∕beating produced by partials measured from the pooled PSTH and the acoustic waveform, respectively. Dissonant intervals contain a greater number of closely spaced partials which produce more roughness∕beating than consonant intervals in both the neural and acoustic domain. See Fig. 4 for interval labels.

