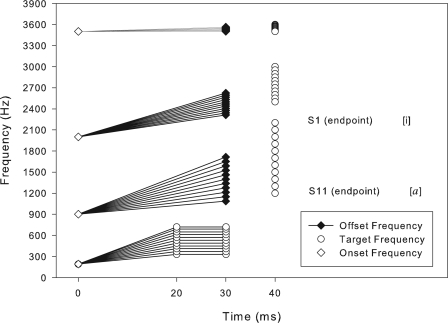
Figure 3.
This figure shows the schematic representation of the first four formants (F1, F2, F3, and F4) for [a]-onset stimuli. The four formants contain 11 stimulus values and each set of 11 values represent the formants from low (F1) to high (F4). S1 and S11 are the [i] and [a] endpoints, respectively. See the Appendix for detailed F1–F4 stimulus values.

