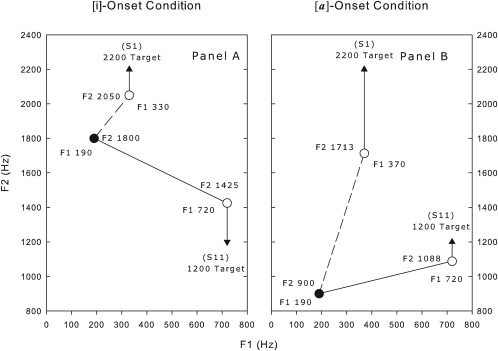
Figure 7.
This shows (A) a representation of the [i]-onset and (B) [a]-onset endpoint (S1 and S11) stimuli in terms of the formant trajectories in the F1–F2 plane. The onset values are the same across stimuli and are depicted with a filled circle. The open circles represent the formant values reached at 30 ms. The arrows indicate the F2 targets not reached by these stimuli. The numerical values within (A) and (B) are in Hz.

