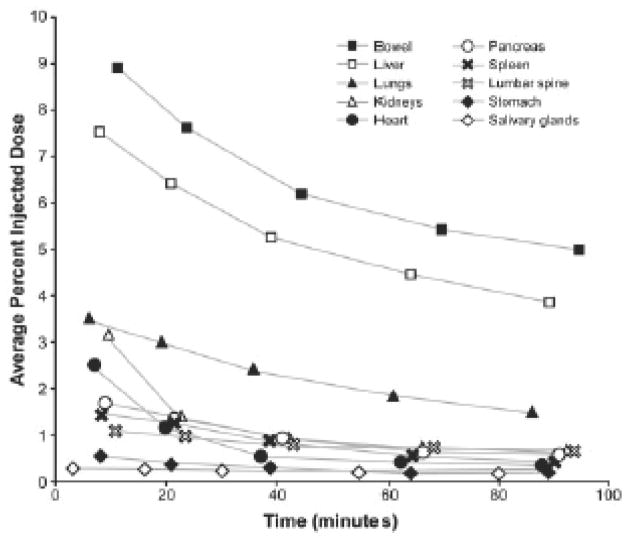
Figure 2.
Tissue time activity curves obtained from serial 11C-acetate images obtained in healthy subjects. Note that activity in pancreas and liver remains relatively high at 100 minutes after tracer injection (Reprinted with permission from reference 31).

