Figure 4.
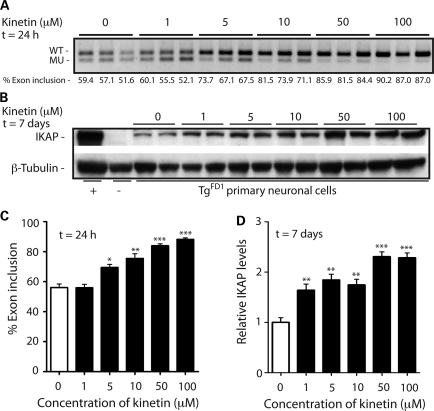
Dose-dependent effect of kinetin on IKBKAP splicing and IKAP levels in TgFD1 neuronal cultures. (A) RT-PCR analysis of three TgFD1 embryos using primers specific to human IKBKAP, following treatment with 1, 5, 10, 50 and 100 µm kinetin respectively for 24 h. The percent exon 20 inclusion (shown below each lane) was determined using the IDV obtained for the WT and MU band. (B) Western blot, probed with an IKAP antibody (top panel), shows an increase in human IKAP protein production in primary neuronal cells following treatment with varying concentrations of kinetin for 7 days. The lower panel represents the same blot probed with β-tubulin antibody as a protein-loading control. Human brain and C57BL6 mouse liver were used as positive (+) and negative (−) controls, respectively. (C) Plotted bar charts show the quantification of percent exon 20 inclusion in three TgFD1 embryos, following kinetin treatment for 24 h. White and black bars represent the untreated and kinetin-treated primary neuronal cells, respectively. Error bars represent SEM (n= 3). Significant differences observed between the untreated and kinetin-treated primary neuronal cells are represented by * (P< 0.05), ** (P< 0.01) and *** (P< 0.0005); Student's t-test. (D) Bar charts show the densitometric analysis on western blots of neuronal cells treated with 1, 5, 10, 50 and 100 µm kinetin, respectively, for 7 days. White and black bars represent untreated and kinetin-treated primary neuronal cells, respectively. Error bars represent SEM (n= 4). Significant differences from control are represented by *(P< 0.05), ** (P< 0.01) and *** (P< 0.0005).

