Figure 1.
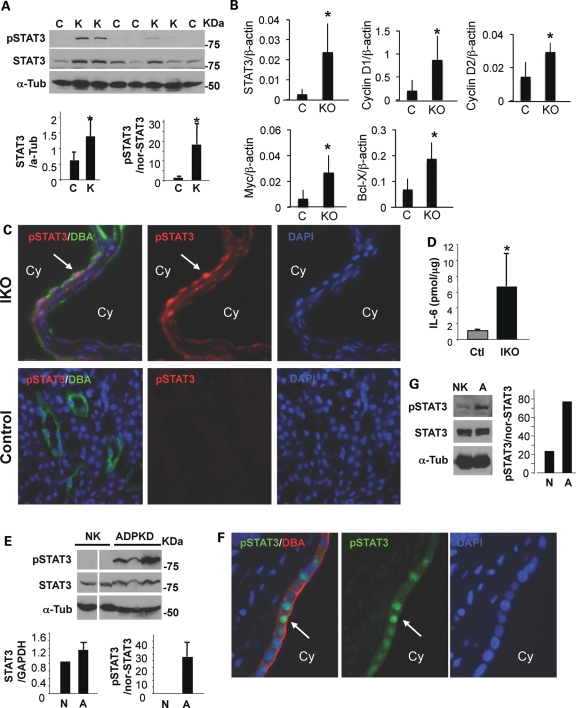
STAT3 is activated in mouse and human cystic kidneys. (A) The kidney lysates from four 1-week-old Col2-Cre+Pkd1 CKO (K) and four littermate control (C) mice were blotted with indicated antibodies. α-Tubulin was used as a loading control. STAT3 expression is normalized to α-tubulin (*P< 0.03) and the ratio of pSTAT3/STAT3 is normalized to α-tubulin (*P< 0.007). (B) Real-time RT–PCR was performed on cDNA from three 1-week-old Col2-CrePkd1 CKO (KO) and three littermate control (C) kidneys. There were significantly increased expression of STAT3 (P< 0.04), c-Myc (P< 0.04), cyclin D1 (P< 0.05), cyclin D2 (P< 0.03) and bcl-X (P< 0.03) in CKO mice. (C and F) Representative immunostaining of kidneys from Mx1Cre+Pkd1 IKO and littermate control mice (C) or from ADPKD patients (F) with anti-pSTAT3 antibodies and DBA. Arrow points to STAT3 nuclear staining in cyst-lining epithelial cells. ‘Cy’ represents cyst lumen. (D) IL-6 production in kidney lysates was measured by enzyme-linked immunosorbent assay [6.69 ± 4.13 (IKO) versus 1.12 ± 0.09 (Ctl)pmol/μg, n= 3 mice per each genotype, *P< 0.04]. (E and G) Western blot of pSTAT3 and total STAT3 in human kidney lysates from five unrelated female individuals (44–63-year-old) with ADPKD (ADPKD) or without ADPKD (NK) (E) and in renal epithelial cells from patients with non-PKD (N) and ADPKD (A) (G). α-Tubulin was used as a loading control. All data shown were expressed as the mean ± SD. The size of STAT3α, STAT3β and α-tubulin is 79, 86 and 55 kDa, respectively. The protein markers are indicated.

