Figure 3.
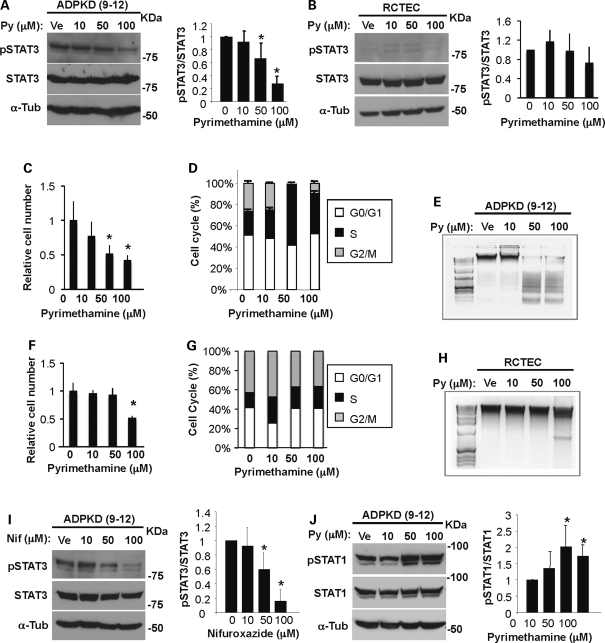
Pyrimethamine inhibits STAT3 tyrosine phosphorylation in human ADPKD cells. Human ADPKD (9–12) cells (A) and non-PKD normal epithelial (RCTEC) cells (B) were incubated with either vehicle (Ve) or pyrimethamine (Py) at the indicated concentrations for 24 h and were blotted with indicated antibodies. Data shown are representative from three independent experiments. The ratio of pSTAT3/STAT3 band intensity is quantified and shown in the right panel (*P< 0.005). Human ADPKD cells (C) and normal cells (F) were treated with pyrimethamine as described above. Viable cells excluding Trypan blue were counted (*P< 0.05). Flow-activated cytometry analysis of human ADPKD cells (D) and normal cells (G) treated with pyrimethamine. Genomic DNA was isolated from human ADPKD cells (E) and normal cells (H) cultured as in (A) and (B) for 3 days. DNA fragmentation was visualized by 1.2% agarose gel electrophoresis. Human ADPKD cells were incubated with vehicle or nifuroxazide (Nif) (I) or pyrimethamine (Py) (J) at the indicated concentrations for 24 h followed by blotting with pSTAT3 (I) or STAT1 (J) or total STAT3 (I) or STAT1 (J). α-Tubulin was used as a loading control. The ratio of pSTAT3/STAT3 band intensity is quantified (*P< 0.005). The ratio of pSTAT1/STAT1 band intensity is shown (*P< 0.03). All data shown were expressed as the mean ± SD from three independent experiments. The size of STAT3α, STAT3β, STAT1α, STAT1β and α-tubulin is 79, 86, 84, 91 and 55 kDa, respectively. The protein markers are indicated.

