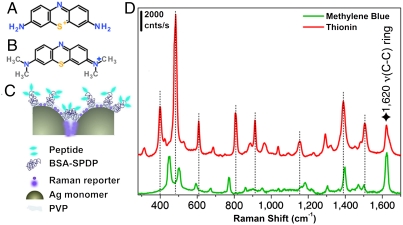
Fig. 1.
Structural description of SBT system and spectra. (A) Thionin. (B) MB. (C) Schematic of a typical silver SBT: Two Ag monomers are encapsulated in a thin polymer shell and functionalized with a modified BSA carrying several copies of a cell-specific or a universal peptide, then the SBTs are infused with a Raman reporter (either thionin or MB). (D) Corresponding SERRS spectra obtained from an ensemble solution of SBTs (approximately 4 per focal volume). The spectra have been shifted along the ordinate axis for clarity, and the dotted lines identify the bands of thionin that are nonoverlapping with bands in the MB spectrum. The star indicates a common band. Laser 633 nm, 10× objective, power at sample approximately 0.11 mW, hole 400 μm, slit 400 μm, and exposure time 1 s × 3 accumulations.

