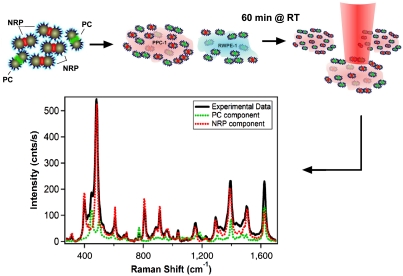
Fig. 3.
Schematic of the SERRS cell mapping experiment. NRP- and PC-SBTs are synthesized, combined, and added to either noncancerous or cancer cells suspended in DMEM supplemented with 10% FBS. These are incubated for 60 min at room temperature. Cells are placed on a microscope slide, and their SERRS spectrum is acquired using microRaman. The sample is mapped along the x and y axes in 1.5-μm steps, 5-μW power at sample, 1-s exposure time. The SERRS spectrum averaged over the whole cell area is deconvoluted into the individual components.

