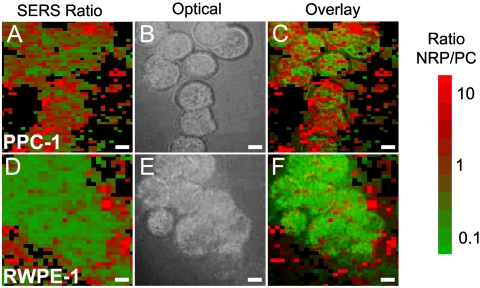
Fig. 4.
Two-dimensional mappings for cancer and normal cells. Color indicates the NRP/PC ratio extracted by deconvolution of the point-by-point SERRS spectra across the scanned area of a group of (A) PPC-1 cells and a group of (D) RWPE-1 cells. Bright field image of (B) the same PPC-1 and (E) RWPE-1 cells. (C and F) The corresponding image overlays. Color code indicates the NRP/PC ratio ranging from 0.1 (green) to 10 (red). Scale bar, 5 μm.

