Fig. 6.
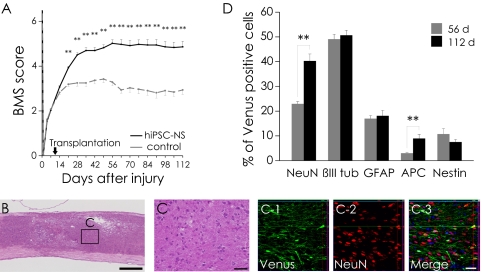
Long-term observation revealed no tumor formation after hiPSC-NS transplantation. (A) For 112 d, motor function in the hindlimbs was assessed weekly by the BMS score. Values are means ± SEM. (B) Representative H&E image of hiPSC-NS–grafted mice. (C) Boxed area in B. (C-1–C-3) Immunohistochemistry showing normal neural differentiation of the grafted cells. (D) Percentages of cell-type–specific marker-positive cells among the Venus+ human cells 56 and 112 d after SCI. Values are means ± SEM (n = 4 and 5, respectively). **P < 0.01. (Scale bars, 500 μm in B; and 50 μm in C.)

