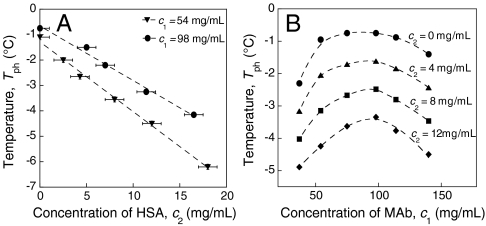
Fig. 2.
(A) Decrease of LLPS temperature, Tph, vs. the HSA concentration, c2, at fixed MAb concentration, c1. Linear fitting of Tph vs c2 at each c1 is shown by the dashed line. (B) LLPS boundaries at fixed c2 shift to lower temperature as HSA concentration, c2, increases (The data were obtained by interpolation of the data in SI Appendix; Fig. S1).

