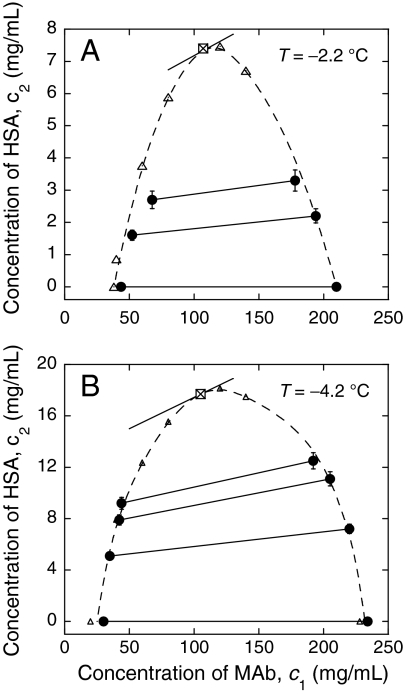
Fig. 3.
Partitioning of MAb and HSA upon LLPS at fixed temperature (A) T = -2.2 °C; and (B) T = -4.2 °C. The points representing the two coexisting phases are connected by the solid lines, i.e., the tie lines. Dashed lines are eye guides for the binodal curves fitted from both cloud-point measurements (open triangles) and partitioning measurements (solid circles). The critical points are represented by the crossed square.

