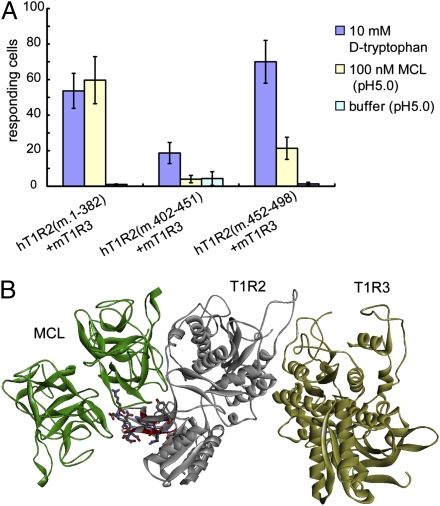
Fig. 6.
The 448 to 494 aa residues are required for hT1R2-hT1R3 to respond to MCL. (A) Responses of the cells expressing each of hT1R2(m.1–382), hT1R2(m.402–451), and hT1R2(m.452–498) together with mT1R3 and G15Gi3. Data are expressed as the mean ± SE (n = 3) numbers of responding cells. (B) Ribbon representation of a docking model in which the intermolecular interactions occur at the region of 448 to 494 aa of hT1R2. MCL, T1R2, and T1R3 are colored green, gray, and yellow, respectively. The residues that are different between human and mouse in this region are colored red. Their side-chain atoms are shown with stick model. Carbon, nitrogen, and oxygen atoms are colored gray, blue, and red, respectively.

