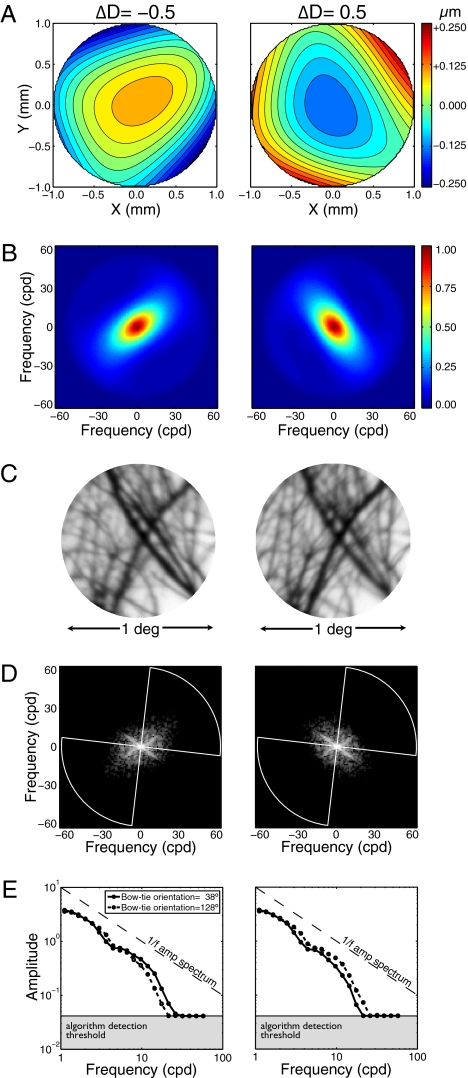
Fig. 3.
Effect of defocus sign in a vision system with human monochromatic aberrations. (A) Wavefront aberration functions of the first author's right eye for −0.5 and +0.5 diopters of defocus (x and y represent location in the pupil aperture). Color indicates wavefront errors in micrometers. (B) Corresponding 2D MTFs. Orientation differences are due primarily to astigmatism. Color indicates transfer magnitude. (C) Image patch defocused by −0.5 and +0.5 diopters. Relative sharpness of differently oriented image features changes as a function of defocus sign. (D) Logged 2D-sampled retinal image amplitude spectra. The spectra were radially averaged within two “bowties” (one shown, white lines) that were centered on the dominant orientations of the negatively and positively defocused MTFs (SI Methods). (E) Thresholded bowtie amplitude spectra. Curves show the bowtie amplitude spectra at the dominant orientations of the negatively and positively defocused MTFs (solid and dashed curves, respectively).

