Fig. 3.
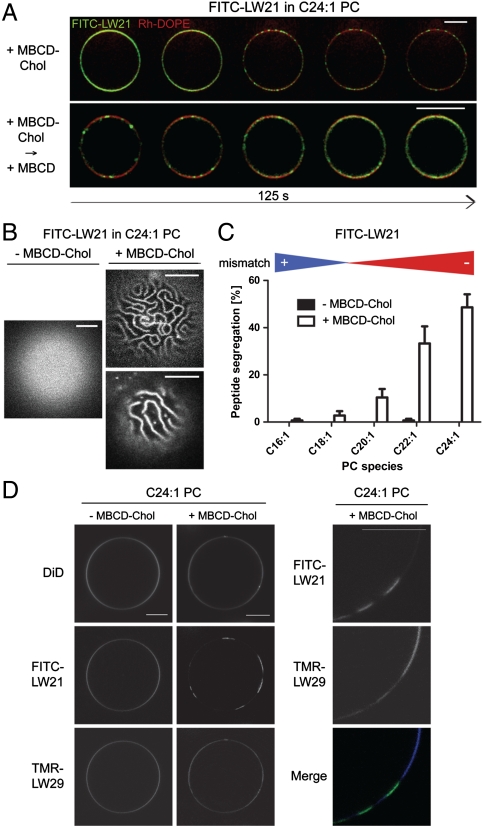
Hydrophobic mismatch and cholesterol determine lateral transmembrane peptide distribution. (A) Fluorescence microscopy images of GUVs depicting the segregation of FITC-LW21 peptide (3 mol%) and lipid marker Rh-DOPE (0.05 mol%) C24∶1 PC (87 mol%) with C18∶1 PC (9.95 mol%) during of 3.8 μM MBCD-cholesterol loading (Upper) and subsequent cholesterol extraction with 1 mM MBCD (Lower) (125 s). (B) Fluorescence microscopy images of GUV apexes depicting the patterns of FITC-LW21 peptide before and after 3.8 μM MBCD-cholesterol loading. (C) Quantification of FITC-LW21 segregation in GUVs before and after 3.8 μM cholesterol loading in different PCs (bars = SEM, n = 3). (D) Fluorescence microscopy images of GUVs depicting the localization of FITC-LW21 peptide (1.5 mol%), TMR-LW29 peptide (1.5 mol%) and lipid marker DID (0.05 mol%) in C24∶1 PC (87 mol%) with C18∶1 PC (9.95 mol%) before and after 8.1 μM MBCD-cholesterol loading. All image bars = 10 μm.

