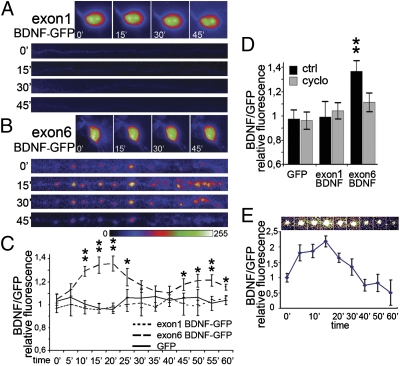
Fig. 2.
Local translation of BDNF transcripts. Video time-lapse tracking of fluorescence in the soma and dendrites severed from the cell body of hippocampal neurons transfected with (A) exon1 BDNF-GFP and (B) exon6 BDNF-GFP and depolarized with 10 mM KCl. Images of dendrites show a straightened 150 μm-long segment. Proximal stump on the left. (C) Quantification of fluorescence in isolated dendrites depolarized with 10 mM KCl for the indicated times (0–60 min). (D) Protein synthesis inhibitor cycloheximide abolishes the fluorescence increase for exon6 BDNF-GFP in isolated dendrites. (E) Video time-lapse tracking of a single spot of exon6 BDNF-GFP fluorescence during KCl depolarization in a dendrite isolated from the soma, and quantification of exon6 BDNF-GFP fluorescence of 10 different puncta during KCl depolarization at the indicated time points (0–60 min). Quantitative data are expressed as the mean of 10 dendrites or somata for each condition. Error bars indicate SE. (*P < 0.05; **P < 0.01; Kruskal–Wallis one-way ANOVA.)

