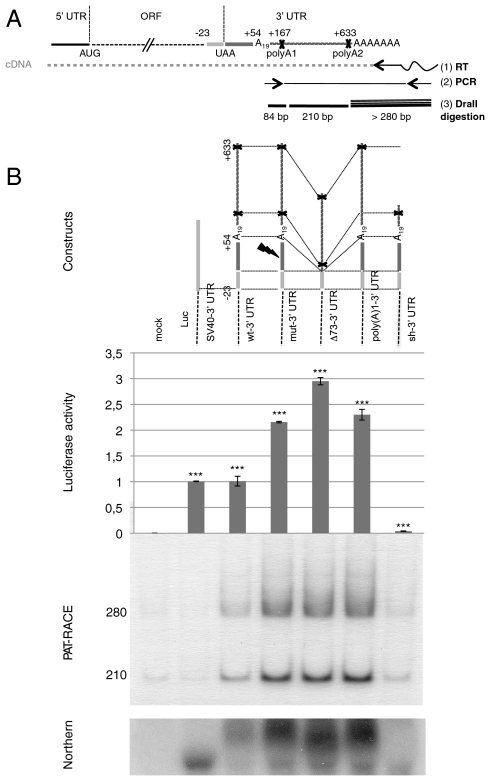
Fig. 1.
AspRS 3′ UTR variants and luciferase reporter gene expression. (A) Global organization of the complete AspRS mRNA and PAT-RACE principle: UTRs and ORF are indicated. Positions numbers are relative to the UAA stop codon. The 3′ UTR contains an Alu sequence located downstream the stop codon (up to position +54) and two predicted polyadenylation signals (polyA1 and polyA2 at positions 167 and 633, respectively). In vitro probing of the junction between the ORF and the 3′UTR showed that the Alu sequence has the capacity to form a stem loop with the last 23 nts of the ORF; therefore, we chose to fuse this entire domain in the reporter system in order to present the Alu sequence in its native structural context (cotranscriptional folding). In PAT-RACE experiments, this mRNA is first reverse transcribed using a “PAT adapter” primer. The resulting cDNA is then amplified using a primer complementary to the adapter and a primer designed intentionally to hybridize after the internal polyA sequence (A19) to avoid background. DraII digestion of radioactive PCR products lead to three fragments of 84, 210, and about 280 nts. This longest fragment is specified by the presence of different polyA tails, initially used to reverse transcribe the mRNA and the shortest fragment was not visible on gels. (B) Schematic representation of reporter constructs: WT-3′ UTR, wild-type sequence including the 23 last nts of AspRS ORF and the 633 nt of the 3′ UTR, Mut-3′ UTR is the Alu mutated version (sequence  was replaced by
  ), Δ73-3′ UTR corresponds to the 3′ UTR missing the 54-nt-long Alu sequence and the 19-A stretch, poly(A)1-3′ UTR has its first poly(A) signal AATAAA mutated into AATGCA and Sh-3′ UTR ends at nt 213 and displays only the first poly(A) signal. Finally, SV40-3′ UTR was used as a control. Gene expression is monitored at the protein level with the luciferase activity (Middle, standard deviation values of three independent transfections) and at the mRNA level (Bottom); relative mRNA concentrations are estimated by RACE-PAT (30) and by Northern blotting. Error bars indicating the standard deviation are given. *** shows statistical significance (AspRS 3′ UTR fusions versus SV40 3′ UTR) at P < 0.001 (Welch’s t test).

