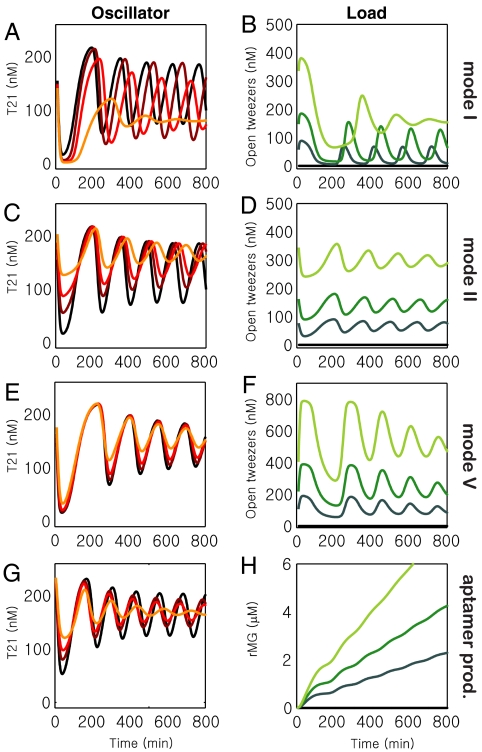
Fig. 6.
Simulations of the core oscillator and oscillator driven loads, using the mechanistic mass-action model described in the SI Appendix, Sections 24–33, for initial DNA concentrations identical to those in several experiments. (A, B): cf. Fig. 3 D and E. (C, D): cf. Fig. 3 I and J. (E, F): cf. Fig. 4 C and D. (G, H): cf. Fig. 5 C and D.

